
Every government deficit is paid for twice: once in taxes for the interest, and again in inflation, when every taxpayer’s dollar buys a little less.
Thesis: public debt does not only borrow money; it helps create it. That new money fuels consumption the economy cannot supply, and taxpayers shoulder the bill through inflation, an indirect cost that is never voted on as a tax. Persistent deficits also encourage a society to consume beyond its means.
With the federal budget arriving on November 5, let’s test this claim with the numbers: first at the scale of the economy, then at the scale of the household.
I. Macroeconomics: how debt becomes money
Most money in Canada is not printed; it is created when someone borrows. When banks or the central bank buy government bonds, new money enters the system, and the government spends it into the economy.
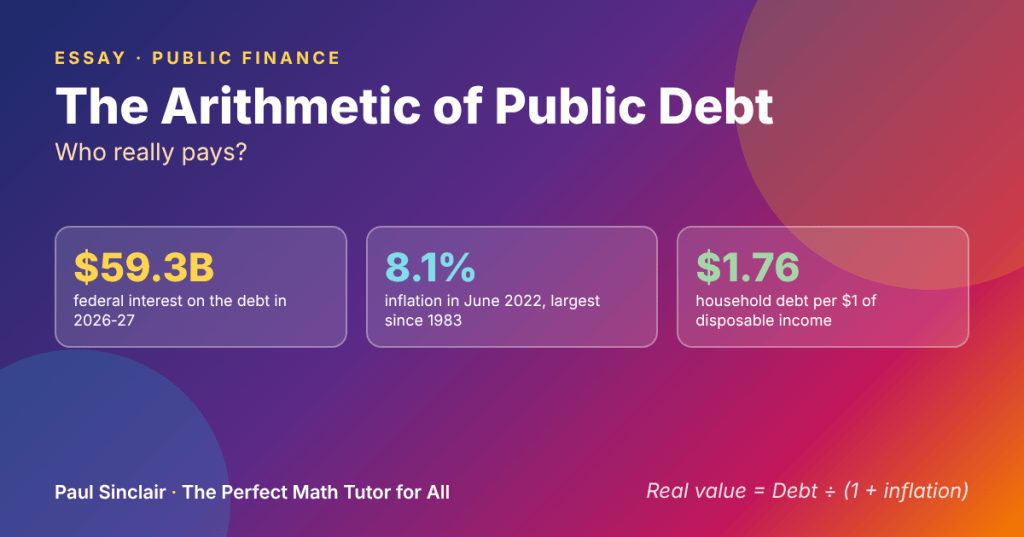
The pandemic showed this on a grand scale. By the end of 2021, the Bank of Canada held about $430 billion of federal bonds, roughly 41% of all outstanding, up from 13% before COVID. It paid by crediting banks’ reserves: new money, created electronically. The Bank states that this was not “printing money,” since the bonds must still be repaid. In economic terms, the effect on the money supply was similar. In June 2022, inflation reached 8.1%, the largest annual increase since January 1983. The Bank of Canada attributes it to global supply shocks and to demand that outpaced supply after reopening.
Inflation also quietly shrinks the debt itself. The real value of a debt after one year is:
Real value = Debt ÷ (1 + inflation rate)
At 8.1% inflation, $1 trillion of debt is worth $1,000 billion ÷ 1.081 ≈ $925 billion in real terms. About $75 billion of purchasing power has moved from the people holding money to the borrower.
II. Macroeconomics: the interest bill
The Bank of Canada stopped buying bonds in 2021. The debt it financed remains and now carries market interest rates.
Ottawa. According to the Parliamentary Budget Officer, federal debt charges rise from $24.5 billion in 2021-22 to $59.3 billion this year and $83.0 billion by 2030-31: more than triple in under a decade. Interest took 10.5 cents of every federal revenue dollar in 2025-26; by 2030-31 it will take 13.6 cents, about one dollar in seven.
Victoria. British Columbia cannot create money; it has no central bank. Every deficit is borrowed from markets and repaid through taxes, cuts or more borrowing. Taxpayer-supported debt rises from $116.5 billion in 2025-26 to $189.0 billion by 2028-29:
(189.0 − 116.5) ÷ 116.5 ≈ 62% in three years
The province’s interest bite climbs from 4.9 to 8.2 cents per revenue dollar. British Columbians fund both federal and provincial interest.
III. Microeconomics: the household ledger
Cheap public borrowing came with cheap private borrowing. Near-zero interest rates told households that tomorrow’s money was almost free today, and household borrowing grew. In the second quarter of 2026, households owed $1.76 for every dollar of disposable income and spent 14.5% of that income on debt payments, according to Statistics Canada. Deficits during periods of growth send a similar signal: consume now, pay later.
Education is also a factor. In my years teaching mathematics in Vancouver, contemporary business mathematics with Canadian applications covered mortgages, amortization, credit, annuities and taxes. In B.C. today, what remains is an introduction to simple and compound interest, loans and investments, a single unit in Pre-calculus 11. Research indicates that this teaching matters: a 2022 review of 76 controlled experiments with more than 160,000 people found that financial education improves both financial knowledge and financial behaviour. Without it, many adults first encounter compound interest on a credit card statement.
Now follow the bill to one household.
The interest. Federal debt charges cost $1,419 per Canadian this year, according to the PBO. For a family of four: 4 × $1,419 = $5,676, rising to 4 × $1,952 = $7,808 by 2030-31. These payments cover past borrowing rather than current services.
The inflation. A retiree with a fixed $50,000 pension who lived through a year of 8.1% inflation could buy only $50,000 ÷ 1.081 ≈ $46,250 worth of goods. The $3,750 difference is a loss of purchasing power. It weighs most on households with fixed or limited incomes: renters, pensioners, young families.
Conclusion: three solutions, by the numbers
Debt is a useful tool when it stays within limits. Three rules can help keep it there.
1. Stop the debt ratio from rising
A debt ratio d stays stable when the deficit, as a share of GDP, is no larger than d times the economy’s nominal growth rate g:
Stable deficit = d × g ÷ (1 + g)
Assuming nominal growth of 4% a year, Ottawa’s 40.8% debt ratio allows a deficit of about 1.6% of GDP. The PBO projects 1.8%. Closing that gap of 0.2 to 0.3 points means about $8 billion to $10 billion a year, a modest adjustment. B.C., with a 30.6% ratio, could run about 1.2% of GDP; it plans 2.9%. Its gap is about $8 billion, on a far smaller budget.
2. Borrow only for what pays back
At today’s 10-year federal bond yield of 3.8%, every $1 billion borrowed costs $38 million a year in interest, forever if never repaid. A bridge, a transit line or a skills program that returns more than 3.8% a year covers its cost. Borrowing for current consumption produces no financial return. The rule is simple: borrow for investment, pay for consumption from revenue.
3. Protect the dollar
The “rule of 72” tells how fast prices double: divide 72 by the inflation rate. At the Bank of Canada’s 2% target, prices double in 36 years. At 8.1%, they double in under 9. Over ten years, $1 keeps 82 cents of its value at 2% inflation but only 68 cents at 4%. That 14-cent difference measures the cost of higher inflation to savers and taxpayers. Two measures follow: keep large central-bank bond purchases exceptional and temporary, and build surpluses in strong years to reduce borrowing in weak ones.
When the budget lands on November 5, measure it against these three rules. Clear figures on each will let citizens judge the plan for themselves.
Sources
- Bank of Canada bond holdings ($430 billion; 41% of federal bonds; 13% before COVID; QE ended 2021): Bank of Canada, Staff Analytical Note 2022-12
- Bank of Canada on “printing money” and repayment of bonds: Bank of Canada, How quantitative easing works
- Inflation of 8.1% in June 2022, largest annual increase since January 1983: Statistics Canada, Consumer Price Index, June 2022
- Causes of the 2021-22 inflation (supply shocks; demand outpacing supply): Bank of Canada, Reflections on 2022
- Federal debt charges ($24.5B, $59.3B, $83.0B; $1,419 and $1,952 per person), debt service ratio (10.5%, 13.6%), deficit (1.8% of GDP) and debt ratio (40.8%): Parliamentary Budget Officer, Economic and Fiscal Outlook, October 2026
- B.C. debt ($116.5B to $189.0B), debt ratio (30.6%) and deficit (2.9% of GDP): Government of B.C., Budget 2026 Fiscal Plan and TD Economics, 2026 British Columbia Budget
- B.C. interest bite (4.9 to 8.2 cents per revenue dollar): TD Economics, 2026 British Columbia Budget
- Household debt ($1.76 per dollar of disposable income) and debt service ratio (14.5%), Statistics Canada data for Q2 2026, as reported by CP24 / Canadian Press, September 11, 2026
- 10-year federal bond yield (3.8%): Financial Post, Posthaste, via Yahoo Finance, October 28, 2026
- B.C. financial literacy content (compound interest, investments, loans): B.C. Curriculum, Pre-calculus 11
- Effect of financial education (76 experiments, 160,000+ people): Kaiser, Lusardi, Menkhoff & Urban, Journal of Financial Economics, 2022 (working paper version)
- Author’s calculations: real value of debt, family-of-four interest cost, pension erosion, stable-deficit rule (assuming 4% nominal growth) and rule of 72.


Leave a Reply